

shadowsun7
Joined 17 years ago
Karma
3,472
Submissions
493
Member since
Jan 13
Joined 17 years ago
My two questions (a) and (b) were not rhetorical. Let’s get concrete.
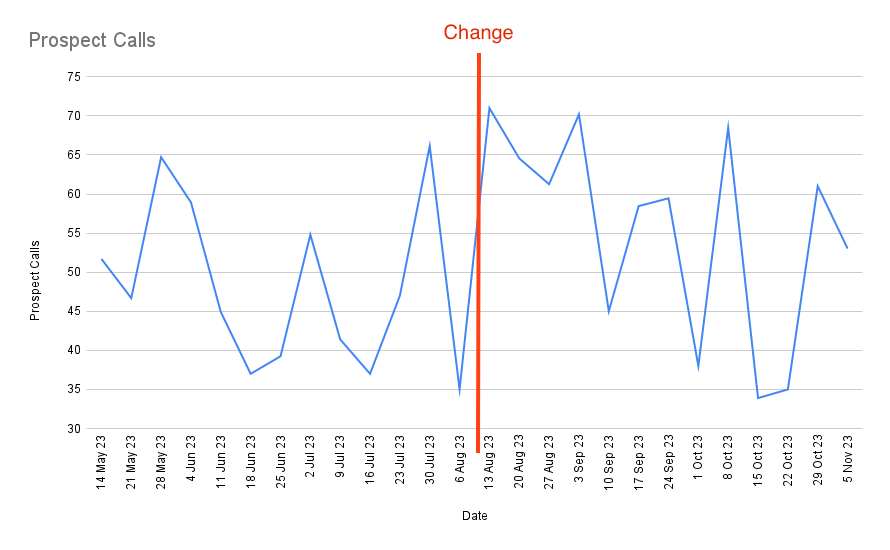
a) You are advising a company to “check back after a certain period”. After the certain period, they come back to you with the following graph:
https://commoncog.com/content/images/2024/01/prospect_calls_...
“How did we do? Did we improve?”
How do you answer? Notice that this is a problem regardless of whether you are a big company or a small company.
b) 3 months later, your client comes back and asks: “we are having trouble with customer support. How do we know that it’s not related to this change we made?” With your superior experience working with hundreds of startups, you are able to tell them if it is or isn’t after some investigation. Your client asks you: “how can we do that for ourselves without calling on you every time we see something weird?”
How do you answer?
(My answers are in the WBR essay and the essay that comes immediately before that, natch)
It is a common excuse to wave away these ideas with “oh, these are big company solutions, not applicable to small businesses.” But a) I have applied these ideas to my own small business and doubled revenue; also b) in 1992 Donald Wheeler applied these methods to a small Japanese night club and then wrote a whole book about the results: https://www.amazon.sg/Spc-Esquire-Club-Donald-Wheeler/dp/094...
Wheeler wanted to prove, (and I wanted to verify), that ‘tools to understand how your business ACTUALLY works’ are uniformly applicable regardless of company size.
If anyone reading this is interested in being able to answer confidently to both questions, I recommend reading my essays to start with (there’s enough in front of the paywall to be useful) and then jump straight to Wheeler. I recommend Understanding Variation, which was originally developed as a 1993 presentation to managers at DuPont (which means it is light on statistics).
https://commoncog.com/becoming-data-driven-first-principles/
https://commoncog.com/the-amazon-weekly-business-review/
(It took that long because of a) an NDA, and b) it takes time to put the ideas to practice and understand them, and then teach them to other business operators!)
The ideas presented in this particular essay are really attributed to W. Edwards Deming, Donald Wheeler, and Brian Joiner (who created Minitab; ‘Joiner’s Rule’, the variant of Goodhart’s Law that is cited in the link above is attributed to him)
Most of these ideas were developed in manufacturing, in the post WW2 period. The Amazon-style WBR merely adapts them for the tech industry.
I hope you will enjoy these essays — and better yet, put them to practice. Multiple executives have told me the series of posts have completely changed the way they see and run their businesses.
Reality has a lot of detail. It’s nice to quote books about goals. It’s a different thing entirely to achieve them in practice with a real business.
https://commoncog.com/the-amazon-weekly-business-review/
Over the past year, Roger and I have been talking about the difficulty of spreading these ideas. The WBR works, but as the essay shows, it is an interlocking set of processes that solves for a bunch of socio-technical problems. It is not easy to get companies to adopt such large changes.
As a companion to the essay, here is a sequence of cases about companies putting these ideas to practice:
https://commoncog.com/c/concepts/data-driven/
The common thing in all these essays is that it doesn’t stop at high-falutin’ (or conceptual) recommendation, but actually dives into real world application and practice. Yes, it’s nice to say “let’s have a re-evaluation date.” But what does it actually look like to get folks to do that at scale?
Well, the WBR is one way that works in practice, at scale, and with some success in multiple companies. And we keep finding nuances in our own practice: https://x.com/ejames_c/status/1849648179337371816
I don't have his permission to tell some of these stories, but Eugene Wei has some hints of it here: https://www.eugenewei.com/blog/2017/11/13/remove-the-legend
(To be fair to you, you are adamant that SPC does not apply to software development — which I take to mean measuring the productivity or act of building software. And I think we are all in agreement there! (That said, like kqr and jacques_chester, I want to believe that this has not been sufficiently explored) But it's not true that SPC has no place in software development — one way I've used this is that because XmR charts detect changes in variation, you can use it in a customer-facing software context to see if a feature change has resulted in user behaviour change without running an A/B test. Naturally, it makes sense to have the software engineer be responsible for observing this behaviour change themselves, since XmR charts are easy enough for the layman to use, and it gives them a sense of ownership for the feature or change. Some detail (on usage vs A/B tests) here: https://commoncog.com/two-types-of-data-analysis/)
He can't make this claim (about ~half falling above/below the average line), because one of the core arguments he makes is that XmR charts are usable even when you're not dealing with normal distributions. He argues that the intuition behind how they work is that they detect the presence of more than one probability distribution in the variation of a time series.
Some links below:
Arguments for non-normality:
https://spcpress.com/pdf/DJW220.pdf
https://www.spcpress.com/pdf/DJW354.Sep.19.The%20Normality-M...
Claim of homogeneity detection:
My current simplistic (and very dumb!) solution that I've used for power-law type distributions — like HN virality, for instance — is to count the number of days between viral events, and then subject that to process control.[1] I basically take Wheeler's approach to chunky data and use that for J-curve type data, which tells me if the behaviour of my 'HN virality process' has changed.
I'd be very interested to learn of other approaches.
[1] HN traffic for commoncog.com displays routine variation most weeks with an Upper Process Limit of 192 and a Lower Process Limit of 0, unless one of my articles hit the front page, at which point I get 11-16k additional uniques).
(From a brief reading of this thread, it seems like kqr, jacques_chester, and I are the only ones who have put this to practice in non-manufacturing contexts — though correct me if I'm wrong.)
The bulk of the debate in this HN thread seems to be centred around what is or isn't a 'stable process'. I think this is partially a terminology issue, which Donald Wheeler called out in the appendix of Understanding Variation. He recommends not using words like 'stable' or 'in-control', or even 'special cause variation', as the words are confusing ... and in his experience lead people to unfruitful discussions.
Instead, he suggests:
- Instead of calling this 'Statistical Process Control', call this 'Methods of Continual Improvement'
- Use the term 'routine variation' and 'exceptional variation' whenever possible. In practice, I tend to use 'special variation' in discussion, not 'exceptional variation', simply because it's easier to say.
- Use the term 'process behaviour chart' instead of 'process control chart' — we use these charts to characterising the behaviour of a process, not merely to 'control' it.
- Use 'predictable process' and 'unpredictable process' (instead of 'stable'/'in-control' vs 'unstable'/'out-of-control' processes) because these are more reflective of the process behaviours. (e.g. a predictable process should reliably show us data between two limit lines).
Using this terminology, the right question to ask is: are there processes in software development that display routine variation? And the answer is yes, absolutely. kqr has given a list in this comment: https://news.ycombinator.com/item?id=39638491
In my experience, people who haven't actually tried to apply SPC techniques outside of manufacturing do not typically have a good sense for what kinds of processes display routine variation. I would urge you to see for yourself: collect data, and then plot it on an XmR chart. It usually takes you only a couple of seconds to see if it does or does not apply — at which point you may discard the chart if you do not find it useful. But you should discover that a surprisingly large chunk of processes do display some form of routine variation. (Source: I've taught this to a handful of folk by now — in various marketing/sales and software engineering roles —and they typically find some way to use XmR charts relatively quickly within their work domains).
[Note: this 'XmR charts are surprisingly useful' is actually one of the major themes in Wheeler's Making Sense of Data — which was written specifically for usage in non-manufacturing contexts; the subtitle of the book is 'SPC for the Service Sector'. You should buy that book if you are serious about application!]
I realise that a bigger challenge with getting SPC adopted is as follows: why should I even use these techniques? What benefits might there be for me? If you don't think SPC is a powerful toolkit, you won't be bothered to look past the janky terminology or the weird statistics.
So here's my pitch: every Wednesday morning, Amazon's leaders get together to go through 400-500 metrics within one hour. This is the Amazon-style Weekly Business Review, or WBR. The WBR draws directly from SPC (early Amazon exec Colin Bryar told me that the WBR is but a 'process control tool' ... and the truth is that it stems from the same style of thinking that gives you the process behaviour chart). What is it good for? Well, the WBR helps Amazon's leaders build a shared causal model of their business, at which point they may loop on that model to turn the screws on their competition and to drive them out of business.
But in order to understand and implement the WBR, you must first understand some of the ideas of SPC.
If that whets your interest, here is a 9000 word essay I wrote to do exactly that, which stems from 1.5 years of personal research, and then practice, and then bad attempts at teaching it to other startup operator friends: https://commoncog.com/becoming-data-driven-first-principles/
I don't get into it too much, but the essay calls out various other applications of these ideas, amongst them the Toyota Production System (which was bootstrapped off a combination of ideas taught by W Edwards Deming — including the SPC theory of variation), Koch Industries's rise to powerful conglomerate, Iams pet foods, etc etc.
As an update, I temporarily relocated to a different city and spent four months training Judo for five hours every day and have since reached the vocab point for the sport. That experiment was covered here: https://commoncog.com/expertise-acceleration-experiment-judo... and https://commoncog.com/mental-strength-judo-life/
I'm looking forward to trying Discourse chat — if the level of engineering and thoughtfulness is the same as the rest of the feature-set, it'll be a great addition to my community.
Well, it seems you're drawing on the same argument that has already been addressed (or at least mentioned in passing) in the article.
So ... pop quiz: how is reading for concept instantiations different from reading for patterns?
Sporadic Internet writer.
I use Go, Python, Ruby, Javascript, Java, and PHP, and in that order.